I approached our October 2018 meeting with some trepidation. The topic “Probing the Dark Universe” usually leaves me as much in the dark at the end as at the beginning. This time, thanks to our brilliant speaker Dr David Bacon of the Institute of Cosmology and Gravitation at Portsmouth University, I felt rather more enlightened.
Dr Bacon pointed out that cosmologists are not that interested in features as small as our Solar System, or the Milky Way, or indeed our local cluster of galaxies. They definitely look at the Bigger Picture and it is here that anomalies have been detected, leading to theories about dark matter and dark energy.
Evidence for dark matter
Dr Bacon gave us three pieces of evidence which show that gravitational forces are stronger than they are predicted to be just using information about the mass of visible material. The first two are relatively straightforward and relate to how objects move within their gravitational field. Firstly, there is not enough gravitational attraction in our Milky Way by a factor of five to explain the speed of orbiting of our Sun round its centre. If you then look at how quickly galaxies in our Supercluster are being drawn together, you get that factor of five again. The gravitational forces are five times greater than the mass of those galaxies should provide.
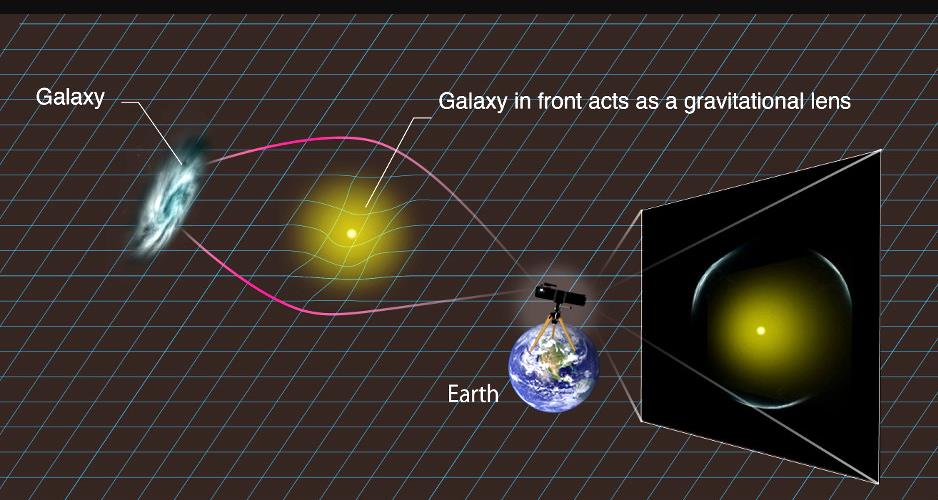
His third example relates to gravitational lensing. This is an effect originally predicted by Einstein in which a distant object such as a galaxy or quasar that should be hidden from our view as it is directly behind a nearer galaxy can be visible as light is bent as it passes that galaxy. The diagram shows the effect of strong gravitational lensing which is a relatively rare event.

Far more common is weak gravitational lensing. Here you are looking at distant galaxies which are in our direct line of sight. Their images are somewhat distorted in a characteristic way by the presence of nearer mass.
In both cases, you can identify how much lensing has occurred and relate this to the amount expected given the visible mass of the intervening material. Once again, you get to the factor of 5; there must be 5 times more mass as observed to give the actual extent of lensing.

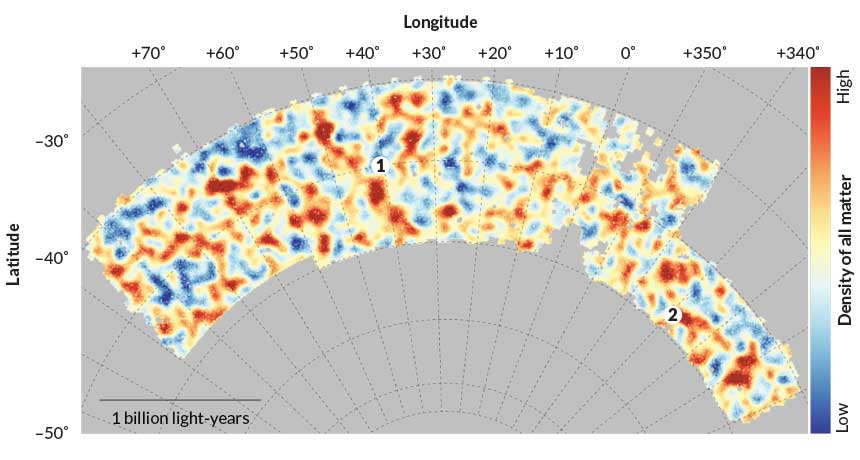
From all these observations about gravitational lensing, you can work backwards to produce a map of dark matter. The image shows part of the Southern sky and is credited to Chihway Chang of the University of Chicago.
Dr Bacon likened the process of making this map to re-creating the design of a front door with a bubble glass panel. This distorts the image of the person on the other side. If you know what the person looks like, you can use the distorted image to work out the pattern of the bubble glass . In this analogy, the intervening dark matter is the bubble glass.
Evidence for dark energy
For me, parts of cosmology seem to rely solely on mathematically-based theories and I find these well-nigh impossible to follow. I much prefer dealing with observational evidence and this is what Dr Bacon gave us.
For many years, there was a reasonably straightforward picture of how the Universe was behaving. After the Big Bang and the rapid expansion of the Universe, the only force acting was gravity. This would slow down the expansion and could possibly cause it to stop, with the matter of the Universe then collapsing back in on itself. This is now thought to be wrong – there is another effect and this is called dark energy.
The evidence for the existence of dark energy is the mismatch between the distance to far-off galaxies found from red shift and that found from the brightness of Type 1a supernovae. The most distant galaxies must have been moving away very fast at the time when the light that has now reached us was emitted (otherwise they would not have got as far away as they have!) This means they will have a large red shift and Hubble’s Law can be used to estimate their distance.
The second estimate of distance comes from the brightness of Type 1a supernovae. These are so-called standard candles in that they are known to emit the same amount of energy, therefore they all have the same absolute brightness. When we measure their apparent brightness, we can use the simple inverse square law to find out how far away they are. The results show that these galaxies are further away than the red shift analysis shows. Red shift tells us how far away the galaxies should be. The Type 1a supernovae tell is how far away they actually are.

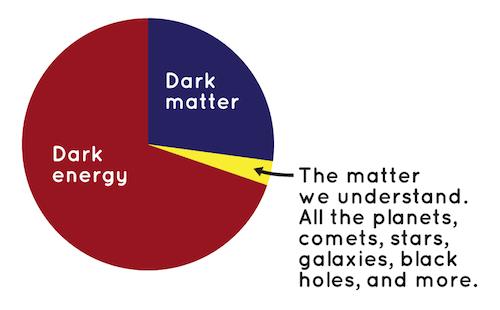
How to explain the anomaly between red shift and supernovae results? There must be some agent other than gravity which is in effect forcing galaxies apart, making the expansion accelerate rather than slow down. This agent is called dark energy. Given the correspondence between mass and energy as given in Einstein’s famous equation, we can combine the information about visible matter, dark matter and dark energy in one piechart, showing that the matter we see forms a very small part of the total Universe (only about 5%). Dark matter is five times greater than this at about 25%. The rest is dark energy.
The best question after the talk posed the possibility that there may be yet another factor at work, currently unknown and that our piechart should not just have 3 parts to it but 4. Our speaker did not deny this possibility!
Talk given David Bacon from Portsmouth University
Post written by Katherine Rusbridge
Oct 2018
