Gaia: mapping the Milky Way and how you can take part.
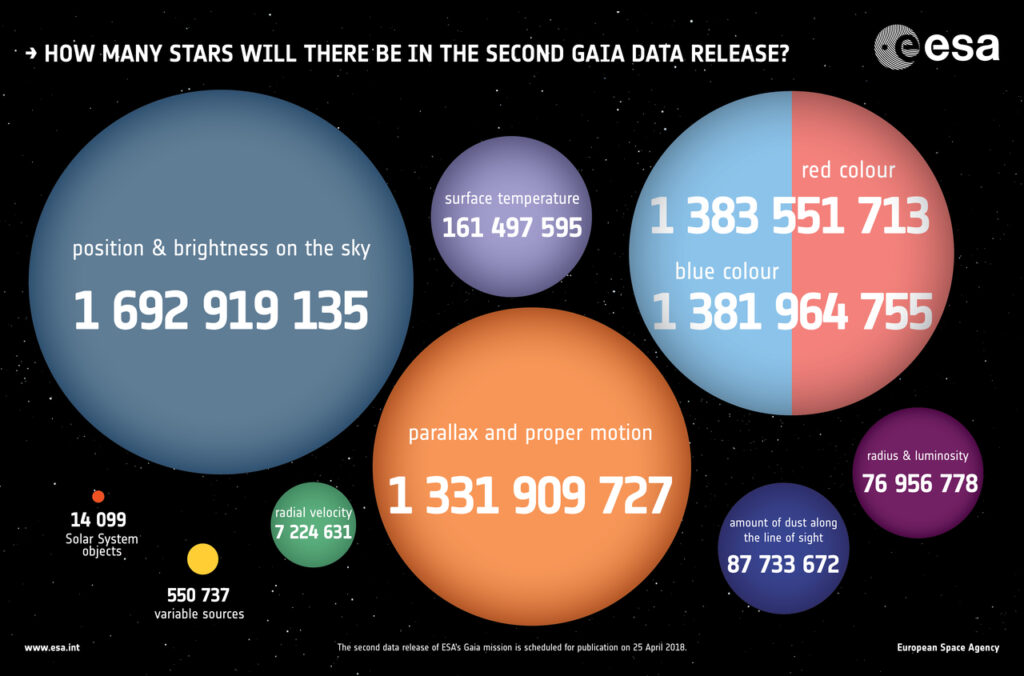
To an Earth-bound observer, the Milky Way looks like a band of light across the night sky. We know it is made of billions of stars but only a tiny proportion of these are bright enough and close enough for us to see individually. The Gaia satellite is aiming not just to distinguish at least 1 billion of its stars but characterise many features such as their position, distance, speed, luminosity and chemical composition with extraordinary accuracy, as explained in our June talk by Dr George Seabroke of the Mullard Space Science Laboratory. It is described as a census of the Milky Way. Here is a graphic giving details about what was made available to the scientific community in their second data release in Aoril 2018.

For more details click here
About Gaia
First some key information about Gaia itself. It is a project run by the European Space Agency (ESA). Launched in 2013, it is positioned at the Lagrange-2 point of the Earth, where the combined gravitational effects of the Sun and Earth ensure that it orbits the Sun at the same rate as the Earth. It is in effect “parked” behind the Earth. It spins such that its field of view sweeps across the night sky. Its mission is planned to last 5 years during which time it will record information on at least 1 billion stars about 70 times for each one. It is intended to be a reference source for decades to come.
The numbers Dr Seabroke gave us were mind-boggling. Gaia records information from 100,000 stars each minute, using an array of 106 CCDs (charge coupled devices) with a total size of about 1000 Megapixels. It is capable of measuring the parallax angle of a star with an accuracy of 0.0001arcsec. Parallax you will recall is one method of finding the distance to a star and it is the apparent shift in position of a star as it is viewed from different locations – which in astrometric terms means from different positions as we (and therefore Gaia) orbit round the Sun. To give us a sense of the scale of this, Dr Seabroke said 0.0001arcsec is about the angle across a thumbnail of an astronaut on the Moon as viewed from Earth.
An example of what we can learn from Gaia’s data
Gaia is not just collecting data for its own sake. It is what is done with that data which matters. Dr Seabroke’s main research interest is in finding the radial velocity of individual stars, using the slight red or blue shift in their spectrum depending on whether they are moving away or towards us respectively. This motion is governed by the gravitational effects of the Milky Way and will contribute to the understanding of dark matter. It can also be used along with proper motion (the motion across the sky as we see it) to plot an orbit for stars, comets etc which can be used to model the origin of the stars. By an amazing coincidence, Dr Seabroke found out only recently that his great-great-grandfather had been one of the pioneers in the use of spectroscopy to find radial velocity. He, poor chap, only managed to characterise about a hundred stars after many many hours of painstaking observations. How he would envy his descendant!
Finding exoplanets
Gaia is also, almost incidentally, a planet hunter. By measuring the brightness of stars at intervals over and over again, Gaia can spot the tell-tale reduction in emitted light when a planet makes a transit across the face of its star. If the planet is large enough, it will cause the star to wobble as the planet orbits around. Using techniques such as these, it is expected that Gaia is likely to find 21,000 planets during its mission. As of the afternoon of June 12th 2018, the day of the talk, 3793 had been identified – and you cannot get information which is much more up-to-date than that!

Gaia alerts
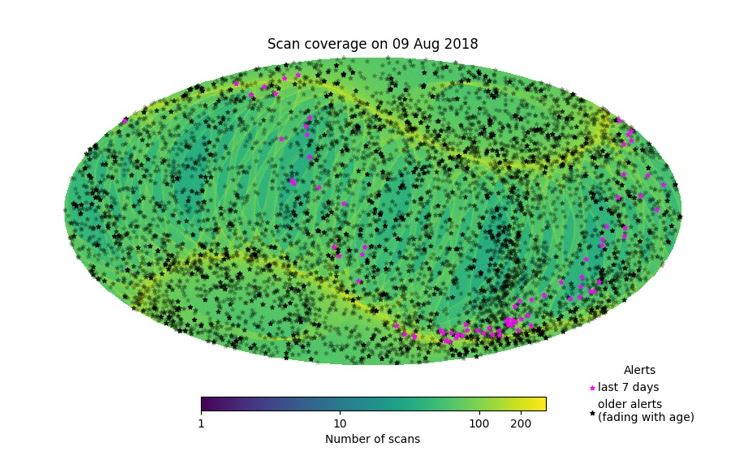
Now let’s consider what Gaia cannot do – and how we can help make use of its data. Unlike its immediate predecessor Hipparchos, it cannot function as a “Stop and Stare” satellite. It is constantly scanning so if it detects something unusual, it just continues on to the next part of the scanning pattern. That “something unusual” may be a supernova or other transient event. By the time it scans that area again, the event might be over and any chance of learning from it will have been missed. This is where Gaia alerts come in. These are posted on a website run by Cambridge University giving full details about the location of the event and commenting on what it might be, giving amateur astronomers an opportunity to monitor the event. If you are interested, click here for the link you need. You will have plenty to choose from as this image of the alerts locations shows. (The image is a screenshot from the webpage)
Enjoy!
Talk given by George Seabroke from the Mullard Space Science Laboratory
Post written by Katherine Rusbridge
Aug 2018
